When quickly glancing at the StockCharts Technical Rank (SCTR) Reports Dashboard panel, one stock that popped up on Monday, albiet briefly, was Meta Platforms, Inc. (META). The stock has a year-to-date performance of over 70% according to the StockCharts Symbol Summary page and, after its recent pullback, the stock could be one to consider adding to your portfolio. You can gain exposure to META either with the underlying or via options.
Analyzing META’s Stock Chart
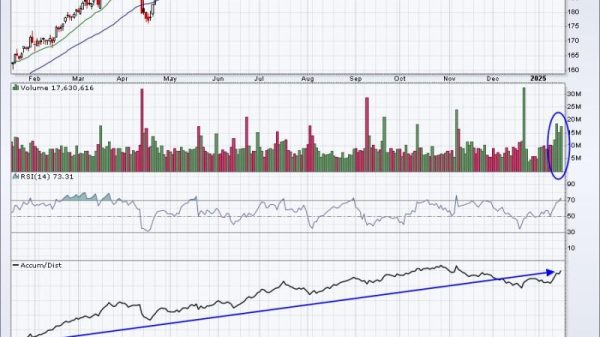
The weekly chart below shows the uptrend in META stock is at a crossroads — it could go up or down. The stock is trading above its 21-day exponential moving average (EMA), the SCTR score is at 79 — it has crossed above my 76 threshold level — and the relative strength index (RSI) has been moving sideways between the 50 and 70 levels since April 2024.
FIGURE 1. WEEKLY CHART OF META STOCK PRICE. The stock is in an uptrend with a rising SCTR score. The RSI needs to move higher to indicate rising momentum.Chart source: StockCharts.com. For educational purposes.
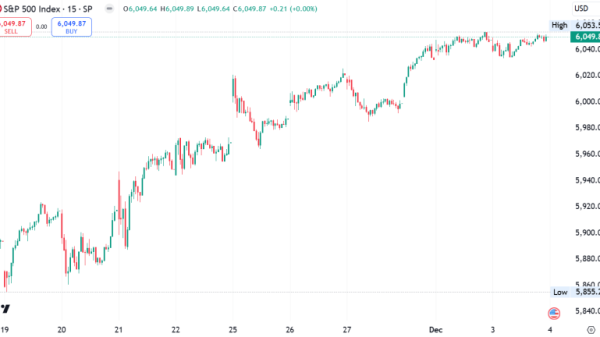
Turning to the daily chart, META pulled back from its all-time high and could be ready for a reversal to the upside. Last Friday, the stock closed at its 50-day SMA and bounced higher from there on Monday. It closed shy of $600 per share, at the top of its daily range. These are early signs of an upside move, but the SMA appears to be flattening.
FIGURE 2. DAILY CHART OF META STOCK. The uptrend isn’t obvious on the daily chart; META’s stock price could go in either direction. The PPO in the lower panel needs to show bullish momentum and there needs to be upside follow-through in price to confirm a reversal to the upside.Chart source: StockCharts.com. For educational purposes.
The trading volume is relatively low, but, given it’s a short holiday week, it’s probably not a good representation of momentum. The percentage price oscillator (PPO) is still negative. There should be upside follow-through in META’s stock price, which could result in the shorter moving average crossing above the longer moving average in the PPO. This would confirm a bullish reversal.
META is in a spot where the price could move in either direction. The stock is trading between its 50-day SMA and a resistance level it hit twice in October. A break below the 50-day SMA would mean watching the $575 level, its next support level. This coincides with its December 2 breakout and previous support and resistance levels. Two lower support levels are its 100-day SMA and the $550 level.
If META’s stock price were to reverse and move higher, its price point of around $600 a share would be steep. Buying 50 shares will cost you about $30,000. An alternative would be to consider options on META.
Options Trade Ideas for META
Looking at the OptionsPlay Explorer (click Options under Tools & Resources in the menu to the left of the chart, then the OptionsPlay button), buying a Feb 21 595/695 call vertical spread would cost $3,335 and have a potential return of almost 200%. But this can change, so you want to monitor any open position carefully.
FIGURE 3. A CALL VERTICAL SPREAD FOR META. The return of 199.85% is respectable, but remember, things change especially as the option approaches expiration so you still need to monitor your trade carefully.Image source: OptionsPlay Strategy Center from StockCharts.com. For educational purposes.
The biggest risk with this trade is META will report earnings before expiration. With a stock like META, volatility tends to be high ahead of earnings, which could drastically impact your trading results. In such a scenario, you have several choices. You could close the position before expiration, especially if you’ve made a decent profit; you could roll the trade to a further expiration; or you could modify the trade and select an expiration date before the earnings report. Click the Modify button and change the expiration dates and/or strike prices of the legs.
If META’s stock price moves lower, consider applying bearish options strategies. Click the bearish button above the risk graphs to see the three optimal strategies to apply. Buying a Feb 21 600/505 put vertical would generate a return of over 200%, with the trade costing you $2,875.
Options are very flexible instruments, and your cash outlay is much lower than buying shares of META. Regardless of which way META’s price moves, there’s an options strategy you can apply. So add META to your ChartLists and, if you have an options-enabled trading account, it’s worth exploring the OptionsPlay Strategy Center on StockCharts.com.
Disclaimer: This blog is for educational purposes only and should not be construed as financial advice. The ideas and strategies should never be used without first assessing your own personal and financial situation, or without consulting a financial professional.


